Description
This course is designed to equip participants with the essential knowledge and practical skills to transform raw data into compelling, insightful visual narratives using industry-leading tools. You’ll master the principles of effective data visualization and leverage tools like Power BI and Tableau to create interactive dashboards and communicate data-driven recommendations effectively.
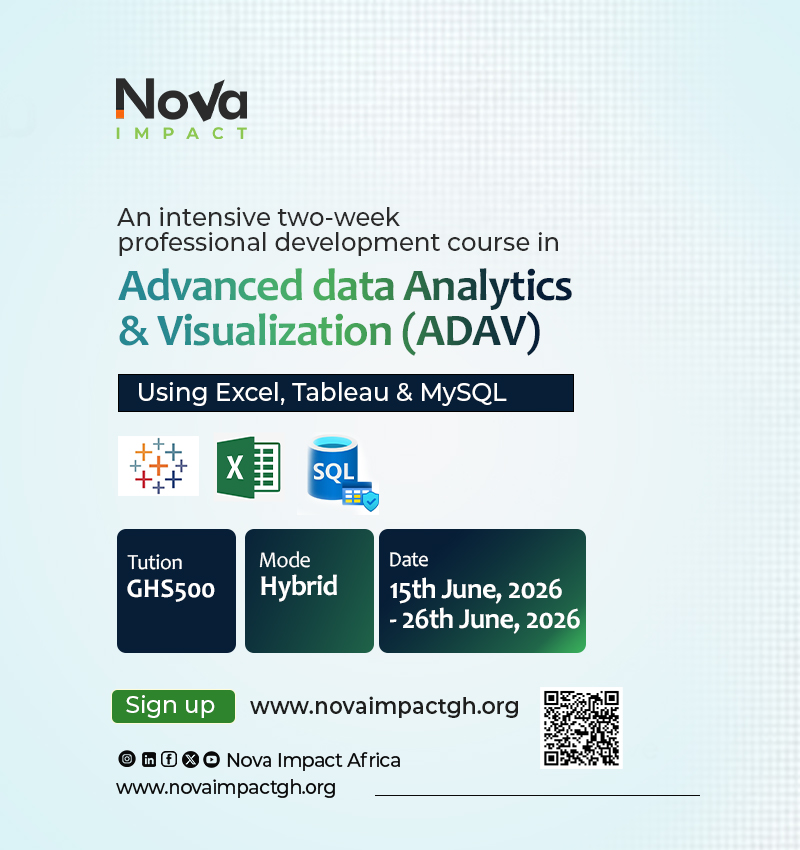
You can also register and pay later here
Key Learning Outcomes
Upon completion of this course, participants will be able to:
-
Understand the fundamental principles and best practices of data visualization and data storytelling.
-
Acquire proficiency in preparing, cleaning, and manipulating data for visualization using tools like Microsoft Excel and Power Query.
-
Create advanced, interactive, and visually appealing dashboards and reports using Power BI and Tableau.
-
Apply Data Analysis Expressions (DAX) and other calculated fields to perform complex data analysis within visualization tools.
-
Identify patterns, trends, and relationships in datasets and effectively communicate these insights to stakeholders.
-
Employ storytelling techniques to convey data insights and drive data-driven decision-making.
Course Outline: Modules and Key Topics
The course is structured into three main modules, focusing on foundational principles, tool-specific mastery, and advanced application.
Module 1: Data Visualization Fundamentals and Excel Preparation
This module provides the foundation for data handling and the principles that underpin effective visual communication.
-
-
Introduction to Data Visualization:
-
The importance of visualization in the data lifecycle.
-
Principles of visual perception (e.g., Gestalt Principles) and chart selection.
-
Understanding different chart types and their appropriate use (e.g., line, bar, scatter, and heatmaps).
-
-
-
Data Preparation with Microsoft Excel:
-
Organizing and cleaning data (handling missing values, duplicates, and inconsistencies).
-
Essential Excel formulas and functions for data manipulation and analysis.
-
Data analysis with PivotTables and PivotCharts.
-
Basic data visualization and automation in Excel.
-
Module 2: Mastery of Power BI for Interactive Dashboards
This module focuses on one of the leading tools for Business Intelligence and dashboard creation.
-
Power BI Introduction and Data Connection:
-
Understanding the Power BI ecosystem (Desktop, Service, Mobile).
-
Connecting to and importing data from various sources.
-
-
Data Transformation and Modeling with Power Query:
-
Cleaning and shaping data using the Power Query Editor.
-
Creating data models, relationships, and advanced data structures.
-
-
DAX and Calculations:
-
Introduction to Data Analysis Expressions (DAX).
-
Creating calculated columns, measures, and key performance indicators (KPIs).
-
-
Creating Visualizations and Reports:
-
Designing and customizing visuals using Power BI Desktop.
-
Building interactive reports with filters, slicers, and drill-through functionality.
-
-
Power BI Service and Collaboration:
-
Publishing reports to Power BI Service.
-
Creating and sharing insightful dashboards and securing data.
-
Module 3: Advanced Visualization, Storytelling, and Other Tools
This final module focuses on advanced techniques and broadening the toolkit with another key visualization platform.
-
Data Storytelling and Communication:
-
Designing effective dashboard layouts.
-
Techniques for weaving a narrative around data insights.
-
Presenting and communicating data-driven recommendations to non-technical stakeholders.
-
-
Introduction to Tableau (or an alternative tool like Looker Studio):
-
Connecting and preparing data in the alternative tool.
-
Creating worksheets and exploring data with different visualizations.
-
Developing interactive dashboards and stories for presentation.
-
-
Case Studies and Practical Application:
-
Hands-on projects covering different industry domains (e.g., marketing, finance, HR).
-
Review of best practices for data accuracy, reliability, and ethics in visualization.
-
Course Methodology
The course features a hands-on approach combining the following:
-
Facilitator-led sessions (online / in-person).
-
In-depth case studies and real-world datasets.
-
Practical exercises and step-by-step tool demonstrations.
-
A Capstone Project requiring participants to design and present a complete, interactive data visualization dashboard from raw data.
About Our Facilitator.
 Adeolu Deborah Boluwatife is a Data Analyst, technology leader, and women empowerment advocate with experience across education, technology, and data‑driven impact. She is the Co‑Founder of Veloxa Technology LTD and the Founder of The Data Diaries With Dee Community, where she champions data literacy, analytics skills, and professional growth. Adeolu has worked with organizations such as Tech4Dev and The Institute for Advanced Teaching and Learning (ITL), contributing to data, learning, and impact initiatives. She currently serves as a STEM Instructor and MEL Lead at InovTech STEM Centre, empowering learners with practical STEM and analytical skills. Adeolu is currently pursuing a Master’s degree in Data Analytics, further strengthening her commitment to empowering women and preparing the next generation for success in technology and data.
Reviews
There are no reviews yet.